Equity markets wrapped up a volatile week with a late-Friday surge that pushed the S&P 500 to a 0.8% gain. Each day last week experienced a swing of at least 2.25%. Ongoing concerns about interest rates, inflation, valuations, and geopolitical challenges are contributing to swings in the market.
Key Points for the Week
- The S&P 500 flirted with a 10% correction from its closing high before rallying to finish the week slightly positive.
- The Federal Reserve left interest rates unchanged while signaling rates were likely to increase at its next meeting in early March.
- U.S. GDP surged 6.9% in the fourth quarter, beating expectations for 5.3% growth.
The Federal Reserve held rates steady while signaling a rate hike is likely in March. Fed Chair Jerome Powell’s press conference contributed to last week’s volatility. He indicated greater concern about inflation and didn’t rule out increasing rates by 0.5% in a single meeting or hiking more rapidly than the market expected.
The GDP report indicated the economy continued to rebound last quarter. U.S. GDP surged 6.9%, beating expectations for 5.3% growth. Most of the growth occurred as firms increased inventory depleted by supply chain challenges. Increased services spending also contributed to growth. Inflation remains a challenge as the personal consumption expenditures price deflator, excluding food and gas, rose 0.5% and is now up 4.9% in the last year.
The MSCI ACWI dropped 1.1% last week. The Bloomberg U.S. Aggregate Bond Index dropped 0.4%. The January employment report headlines economic releases this week.
(Figure 1)
Figure 2
Big Swings
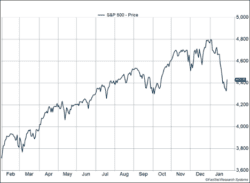
If you only check in on the markets once a week, last week wasn’t all that exciting. The S&P 500 increased an above-average 0.8% after falling the previous week. But if you view the markets as intensely as an NFL fan watching the conference championship games, it was quite volatile. The S&P 500 swung by at least 2.25% every day last week and frequently flirted with closing down more than 10% from its record high.
The Federal Reserve deserves some credit for the volatility. As expected, the Fed announced “it will soon be appropriate to raise the target range for the federal funds rate.” That statement indicates the Fed plans to raise rates at its March meeting. The surprises came during Fed Chair Jerome Powell’s press conference. Investors have been concerned about how quickly the Fed would raise interest rates, and the market interpreted Powell’s comments to mean faster than expected. Investors now expect rate hikes in the next three meetings with a total of five increases this year. Powell didn’t rule out a 0.5% hike in a single meeting and indicated the Fed could reduce its balance sheet while raising rates. The Fed has historically only changed rates every other meeting, so the move to increase rates every meeting was a surprise. The pandemic, high inflation, above-average valuations, and concerns about Russia’s intentions in Ukraine also affected markets.
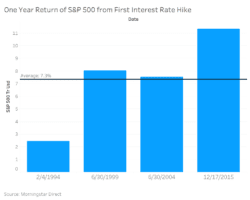
Last week we detailed how higher rates can pressure markets and are a risk worth watching. Yet, recent history shows rate hikes have reduced expected market returns but not turned them negative. In the last four interest-rate-hiking cycles, the S&P 500 averaged an increase of 7.3% in the 12 months following the initial rate hike. It was higher in all four cycles (Figure 2).
Even if the market does close in correction territory, it shouldn’t be viewed as a surprising market event. Corrections are normal; one has occurred in 22 of the last 42 years. In only eight of the 22 corrections did the S&P 500 drop more than 20%. In 13 of the 22 years with a correction, the market finished higher for the full calendar year. That means markets often bounce back from corrections quite quickly. Jumping out of the market when it starts moving lower can make it harder to reach your goals.
This dose of market volatility isn’t setting us back very far or doing grave damage to recently strong returns. Even with the decline the previous week, the S&P 500 is up 18.7% in the last 12 months. At the recent bottom on Thursday, Jan. 27, the S&P was only back to levels from Oct. 5 (Figure 1).
So far, we have focused on fundamental reasons for the decline. Most of the time fundamentals give a reason for markets to drop, but the behavior of market participants is also a likely contributor. As noted above, stock market performance has been quite strong in recent years, and some investors may be scaling back outsized stock positions or locking in gains in appreciated positions. Some of the intraday trading may be caused as much by a rash of selling pressure from nervous investors as anything else.
During periods of volatility, it is natural to feel a little nervous. Every decline is different, but we have been through similar situations. Some get worse, many get better quickly. One key is to not make rash decisions. If you are feeling concerned or have questions, reach out to your advisor.
–
This newsletter was written and produced by CWM, LLC. Content in this material is for general information only and not intended to provide specific advice or recommendations for any individual. All performance referenced is historical and is no guarantee of future results. All indices are unmanaged and may not be invested into directly. The views stated in this letter are not necessarily the opinion of any other named entity and should not be construed directly or indirectly as an offer to buy or sell any securities mentioned herein. Due to volatility within the markets mentioned, opinions are subject to change without notice. Information is based on sources believed to be reliable; however, their accuracy or completeness cannot be guaranteed. Past performance does not guarantee future results.
S&P 500 INDEX
The Standard & Poor’s 500 Index is a capitalization-weighted index of 500 stocks designed to measure performance of the broad domestic economy through changes in the aggregate market value of 500 stocks representing all major industries.
MSCI ACWI INDEX
The MSCI ACWI captures large- and mid-cap representation across 23 developed markets (DM) and 23 emerging markets (EM) countries*. With 2,480 constituents, the index covers approximately 85% of the global investable equity opportunity set.
Bloomberg U.S. Aggregate Bond Index
The Bloomberg U.S. Aggregate Bond Index is an index of the U.S. investment-grade fixed-rate bond market, including both government and corporate bonds.
Russell 1000 Growth
The Russell 1000® Growth Index measures the performance of the large cap growth segment of the US equity universe. It includes those Russell 1000 companies with relatively higher price-to-book ratios, higher I/B/E/S forecast medium term (2 year) growth and higher sales per share historical growth (5 years).
Russell 1000 Value
The Russell 1000® Value Index measures the performance of the large cap value segment of the US equity universe. It includes those Russell 1000 companies with relatively lower price-to-book ratios, lower I/B/E/S forecast medium term (2 year) growth and lower sales per share historical growth (5 years).
https://www.cmegroup.com/trading/interest-rates/countdown-to-fomc.html
https://www.cbsnews.com/news/meme-stocks-one-year-later/
https://graphics.wsj.com/fed-statement-tracker-embed/
Compliance Case # 01259864


